Report (2018)
The Toronto Police Service publishes interesting datasets on their public safety data portal and I found a nice dataset on bicycle-related crimes that was recently published and I thought it was interesting enough to write about. I have had a bike stolen in the city and it’s a horrible feeling – maybe this data can help you avoid having your bike stolen too. There are also tips on theft-prevention at the end of the report.
Note: the data presented only reflects reported crimes, which may not reflect actual bicycle-related crime in the city
Neighbourhoods
Each crime is listed with the neighbourhood of where the crime occurred! Waterfront Communities - The Island comes in first place with almost 1400 reported incidents over 4 years and Pleasant View comes in last with only 5.
Below the top 10 neighbourhoods for having the most crimes. Click on the tabs to see how things have changed over the years.
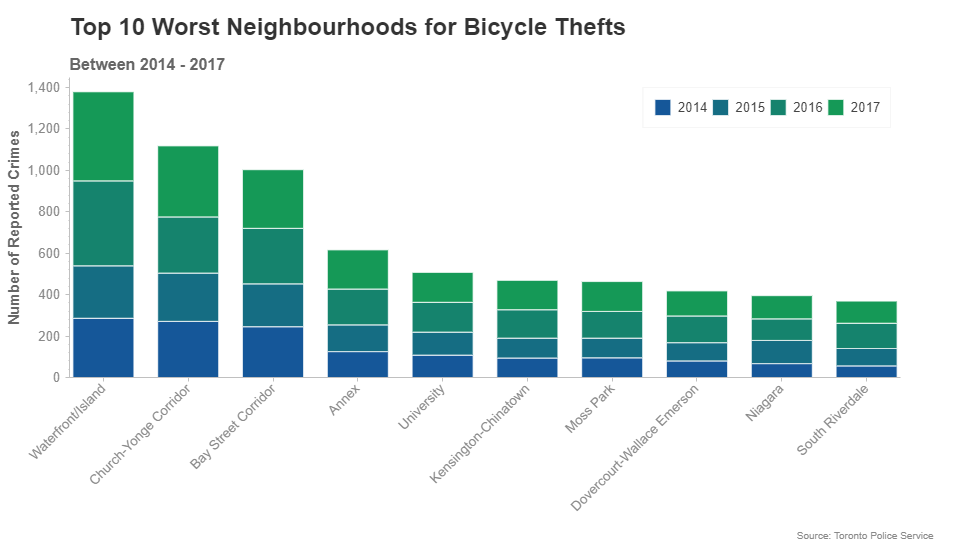
The worst 4 neighbourhoods: Waterfront Communities - The Island, Church-Yonge Corridor, Bay Street Corridor and the Annex are consistently the worst places to be a bicycle owner.
Over the four years, the other neighbourhoods in the top 10 move around and swap with each other without any particular trend.
Rosedale-Moore Park receives the most improved award for being in the top 10 in 2014 and 2015 but not being in the top 10 for 2014 - 2017 (although, still 11th overall)!
South Riverdale gets the least improved award for making the top 10 (2014 - 2017) despite only being in the top 10 for 2016 and 2017.
On a lighter note, here are the top 10 neighbourhoods with the fewest bicycle crimes:
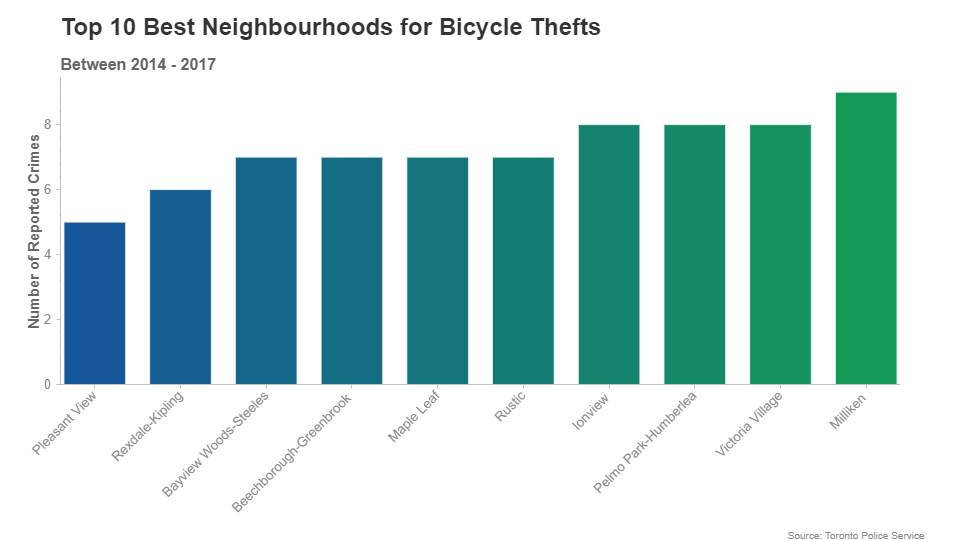
Couldn’t find the neighbourhood you were interested? A full list of neighbourhoods can be found here.
Heat Maps
Think your bike is safe? Moving soon? Check the heat map to see where bike thefts are reported.
Unsurprisingly, the one place where there are no reported bicycle related crimes is the Bridle Path.
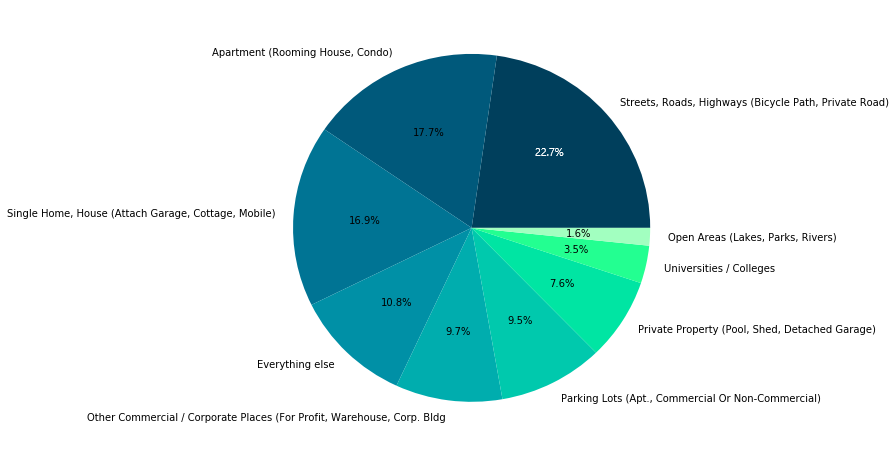
A full list of types of crimes and their counts can be found here.
Most thefts seem to occur on large streets and public places, but it doesn’t mean your bike is safe on private property. More than a third of thefts/crimes happen in houses, apartment buildings and private property.
Time Data
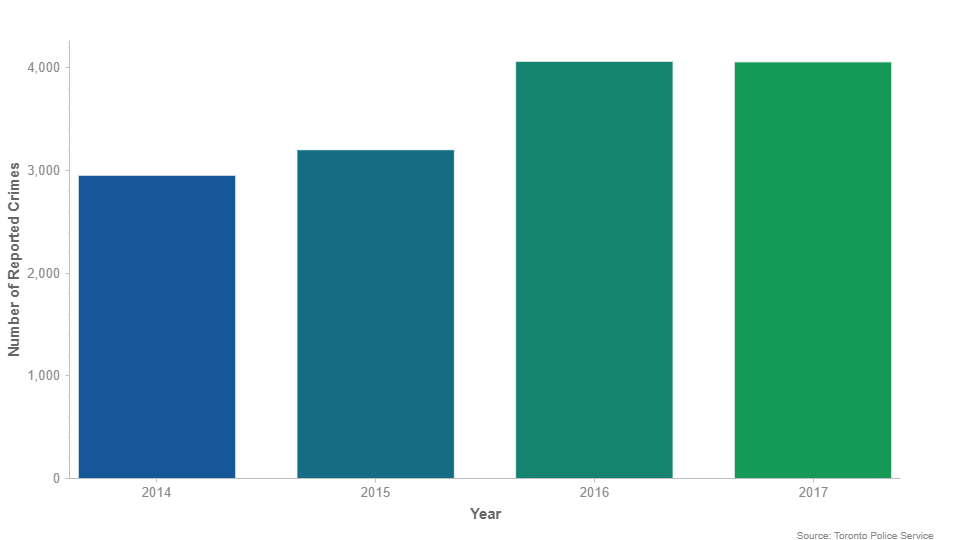
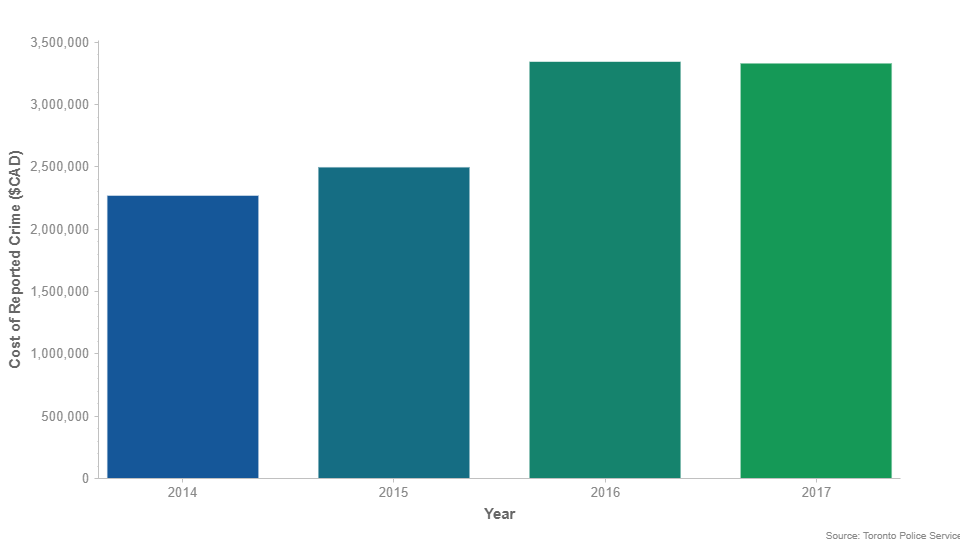
Be careful, bicycle thefts are on the rise. The data shows that the number of reported bicycle crimes have increased in 2016 and 2017 compared to 2014 and 2015. This could be due to the increase in ridership levels throughout 2016 and 2017 due to better cycling infrastructure. The unfortunate reality is that an increase in cyclists also means an increase in bicycle thefts.
Do you know when your bicycle is most likely to be stolen? You might think your bicycle is less safe locked during the night but that is not necessarily be true.
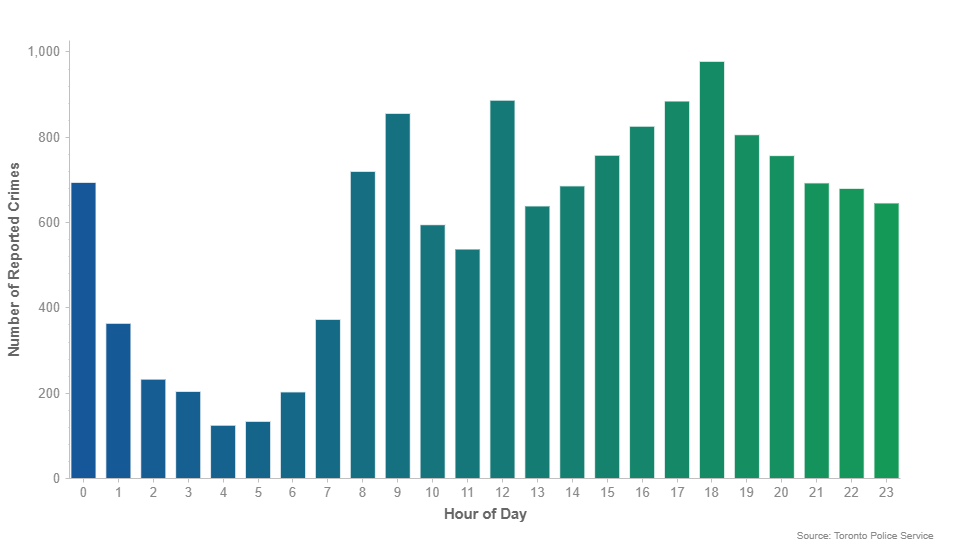
The plot below shows that there are way more thefts during the day than overnight, however because the data only shows reported crimes, this data is skewed to be biased towards daytime crimes.
There are peaks at around 9 AM, 12 PM and 6 PM (corresponding to morning commute, lunch, and evening commute), this is likely because those are the times when people are most likely to notice that their bike has gone missing, again emphasizing the fact that this is only reported data.
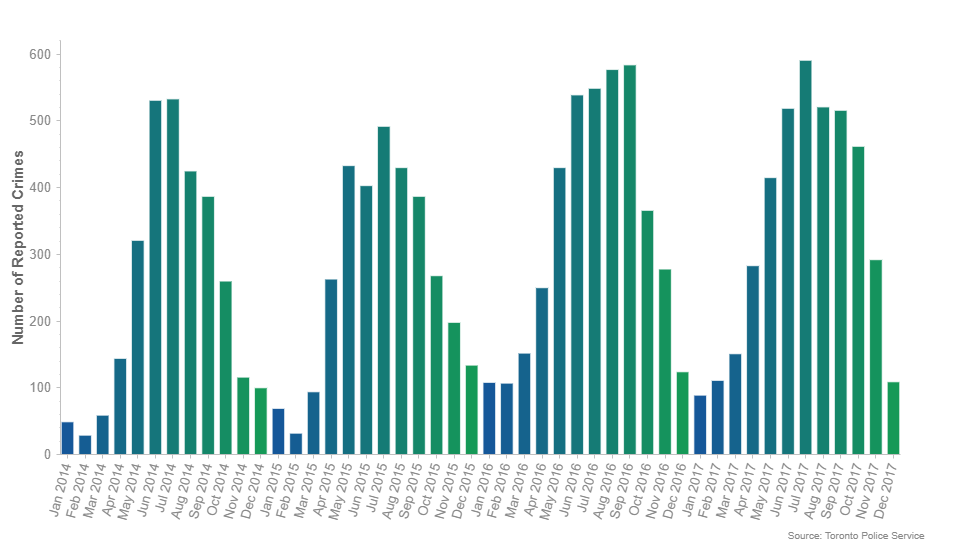
Bicycle-related crimes (mostly theft) spike during the warmer months and slow down during the winter, which makes sense due to lower ridership. The 1-month period with the most reported crimes was July 2017 with 591, or about 19 per day!
Thanks to harsh Canadian winters, your bikes are the most safe around January and February – when bike thieves take go on vacation using your hard earned money.
Cost
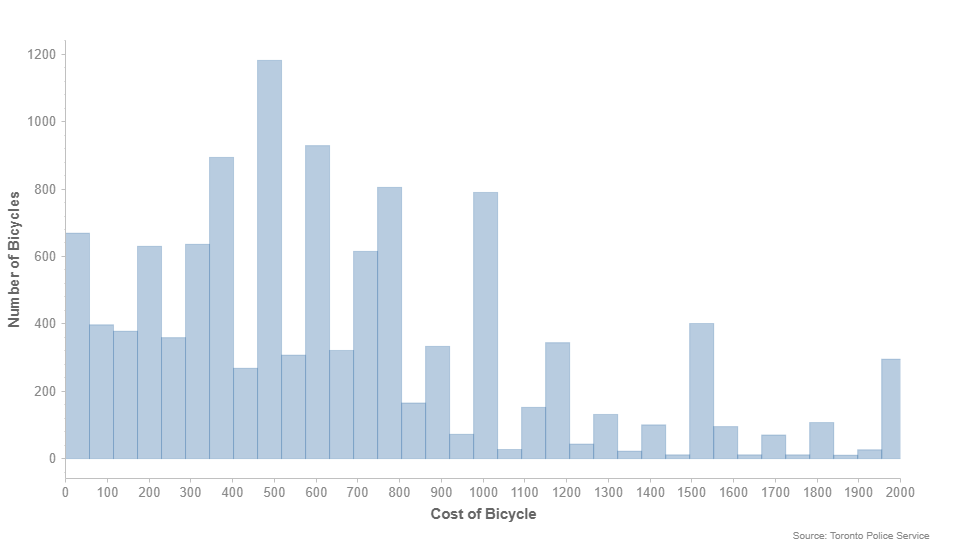
Speaking your hard earned money, the sum of all reported values of the stolen bicycles amounted to over $11,450,000 (excludes 1665 bicycles with “UNKNOWN” values).
This amounts to the average value of a stolen bike to be approximately $907.95, which seems high. This could either mean there are a lot of “low value” bicycle crimes that aren’t being reported or people may be over-reporting the value of their bikes.
Of the recovered 182 recovered bicycles (~1.27%), 118 had reported values which summed up to a measly $120,300. The mean cost of the recovered bicycles was $1019 and median cost was $700.
Below is a truncated histogram showing the cost of stolen bicycles throughout Toronto:
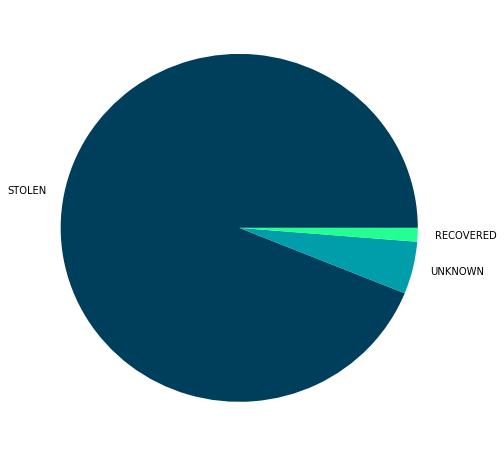
Prevention and Recovery
Do you know what your bicycle’s serial number is? Or where to find it? Knowing the serial number to your bicycle is essential to recovering it if it gets stolen. Between 2014 and 2017 there were approximately 14,000 reported bicycle crimes and only around 1.27% of stolen bicycles were able to be recovered.
If you want to have a chance of getting your bike back after it’s stolen, please register your bike with the Toronto Police here. Your serial number can typically be found on the bottom of your bike, under the bottom bracket shell. Hopefully Toronto might get something like Project 529 where victims can post an alert to fellow cyclists to look out for stolen bikes.
To secure your bike better, consider getting a U-Lock, they are way sturdier than cable locks and are worth it keep your bike safe. Sheldon Brown has a great webpage on lock-strategy. GCN has a very good video as well.
Miscellaneous Stats
Bicycle Color
Can you guess what the most common color of stolen bicycles? It’s black, followed by blue (probably due to the sheer amount of blue Supercycles). A full list of colors of stolen bicycles here.
The most stolen type of bicycle are Mountain Bikes with at least 4,444 of the 14,280 reported being mountain bikes. Only 3 of the 14,280 stolen bikes were unicycles (although, not technically bicycles).
| Bike Type | Count |
|---|---|
| Mountain | 4444 |
| Regular | 3254 |
| Other | 2367 |
| Racer | 1496 |
| Electric | 786 |
| UNKNOWN | 694 |
| Touring | 681 |
| BMX | 214 |
| Scooter | 185 |
| Folding | 108 |
| Tricycle | 27 |
| Tandem | 12 |
| Recumbent | 9 |
| Unicycle | 3 |
The dataset also includes data on the brand of bicycles stolen, but the data can be pretty cryptic (some brands are abbreviated to two letters). A full table can be found here.
Thank you for reading!